One algorithm.
Two sensor systems.
Zero guesswork.
A real-time grip model that reads what your tires are doing — internally, externally, and contextually — and turns five raw signals into a single number you can ride by.
From rubber to display in twelve milliseconds.
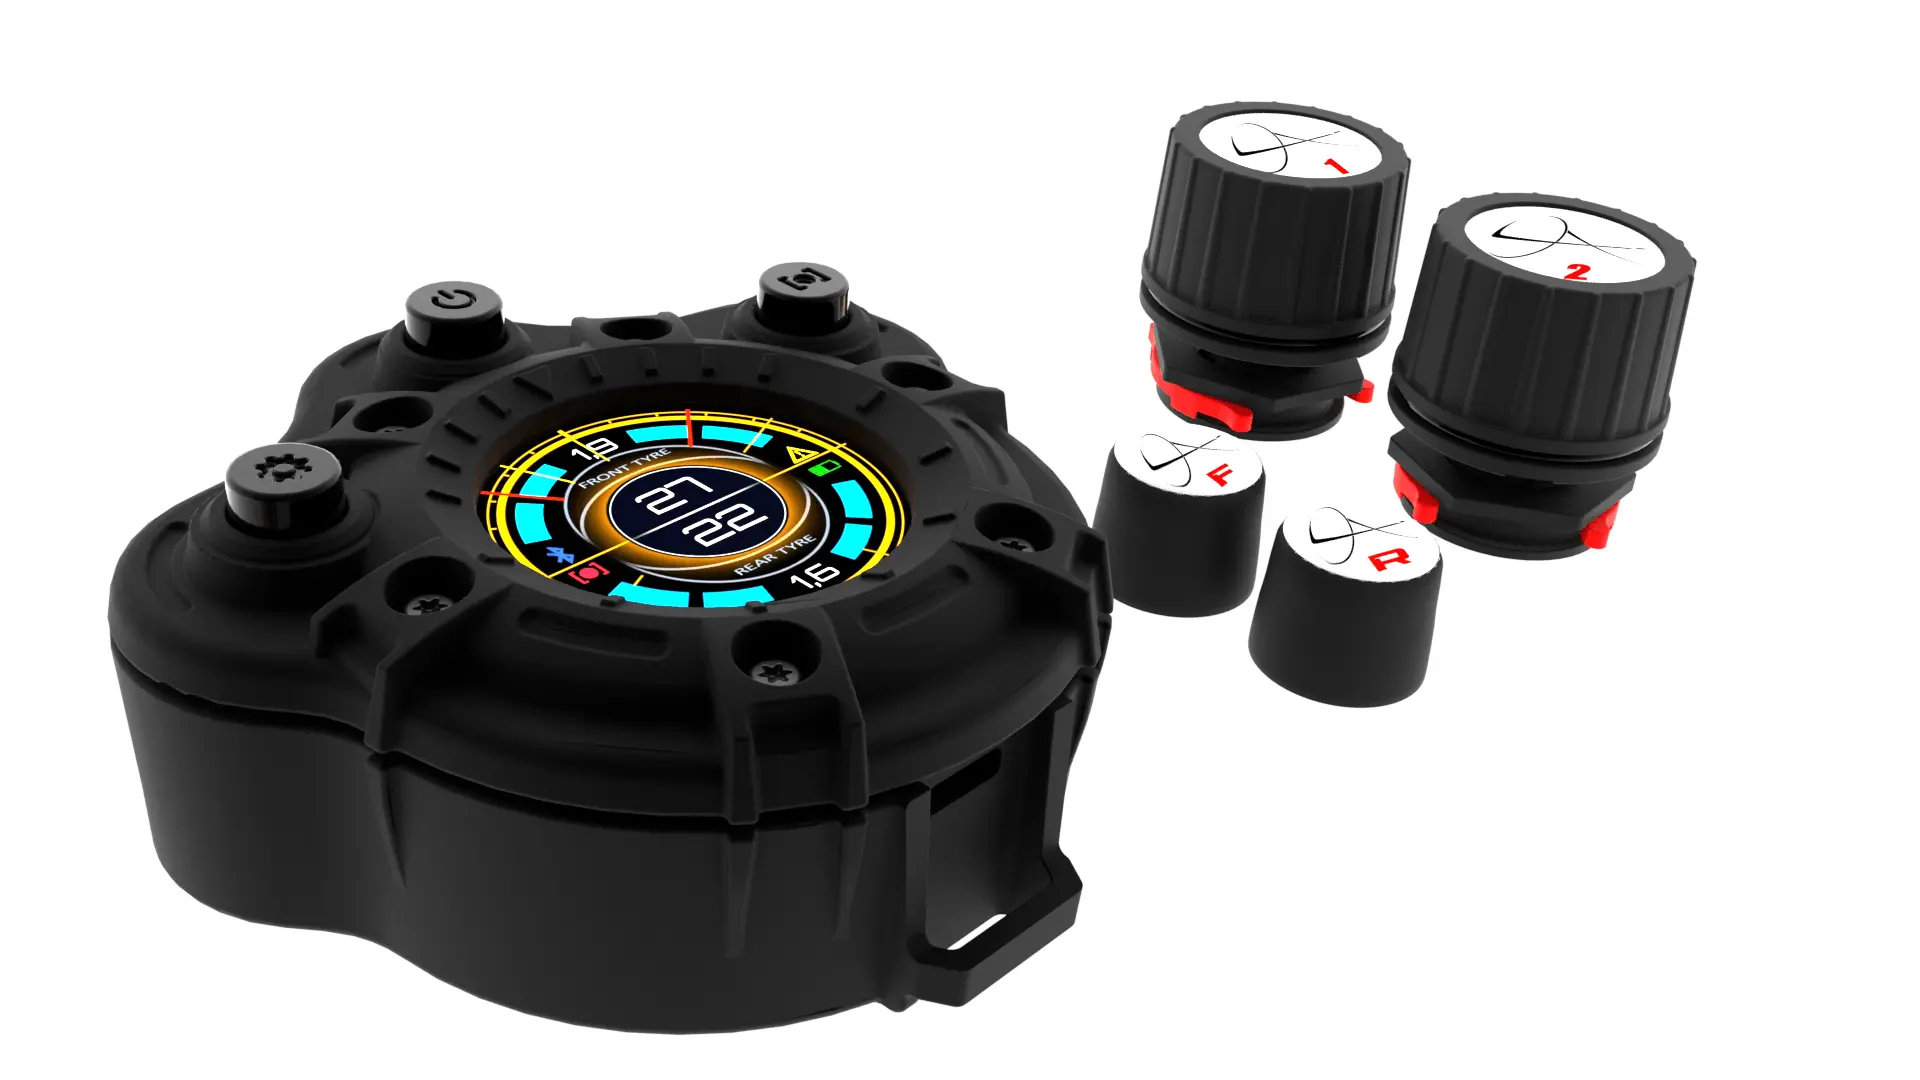
Quasar splits the work across three physical units: sensors inside and on the tire, the Quasar device on the bike, and the firmware that fuses everything into a single score.
Inside & on the tire
TTPMS valve-stem units read pressure and internal air temperature. IR sensors aimed at the contact patch read surface temperature 1000 times per second.
On the handlebar
ARM Cortex M4 receives all sensor streams, runs the T-Grip fusion algorithm locally, and renders the live display — no cloud, no app required.
iOS & Android
Optional. Configures tire compounds, records session telemetry, and reviews past rides with full data export.
What the device reads.
Five inputs. One truth.
Every signal is sampled at 1000Hz, filtered with a Kalman estimator, and timestamp-aligned within ±1ms before the fusion stage.
Internal pressure
TTPMS · Valve stem
Direct measurement from inside the tire chamber. Detects slow leaks, temperature-driven pressure rise, and out-of-range conditions before they reach the rider's senses.
Tire internal air temperature
TTPMS · Air chamber
Tire chamber air temperature. The bulk-thermal proxy — slow to change, but what tells the algorithm whether the carcass has reached operating window.
Surface temperature
IR · Non-contact thermal
Infrared reading of the actual tread surface where rubber meets road. Reacts within 50ms — fast enough to catch the difference between a flick and a sustained lean.
Lean angle
6-axis IMU · Gyro + accelerometer
On-board inertial measurement unit estimates real-time roll angle. Combined with grip score, drives the adaptive red-line indicators on the display.
Tire profile model
Calibrated · per compound
Pre-loaded compound profiles for 47 OEM and aftermarket tires. Each profile maps temperature/pressure/load to expected friction coefficient — the baseline against which live signals are compared.
Five signals.
One number.
The T-Grip fusion algorithm doesn't average. It weights — dynamically — based on which signal carries the most predictive value in the current riding condition. The model adapts every millisecond.
Acquire
Five sensor streams arrive over BLE 5.2 with sequence numbers and timestamps.
2 msFilter
Kalman filter rejects outliers, smooths high-frequency noise, reconstructs missing samples.
3 msAlign
All signals interpolated to a common 1000Hz timestamp grid within ±1ms tolerance.
1 msFuse
Weighted-confidence model combines signals with the compound profile to estimate friction.
4 msRender
T-Grip score (0–100), color zone, and lean-angle limit are pushed to the display.
2 msWhat the score means.
T-Grip is a 0–100 score representing live tire confidence. Below 50, you're outside the safe envelope. Above 80, you're in the operating window. The color zones translate this into a visual language you can read at a glance, leaned over, at 200 km/h.
Built in Turin.
Tested everywhere.
Quasar · IP67 alloy housing
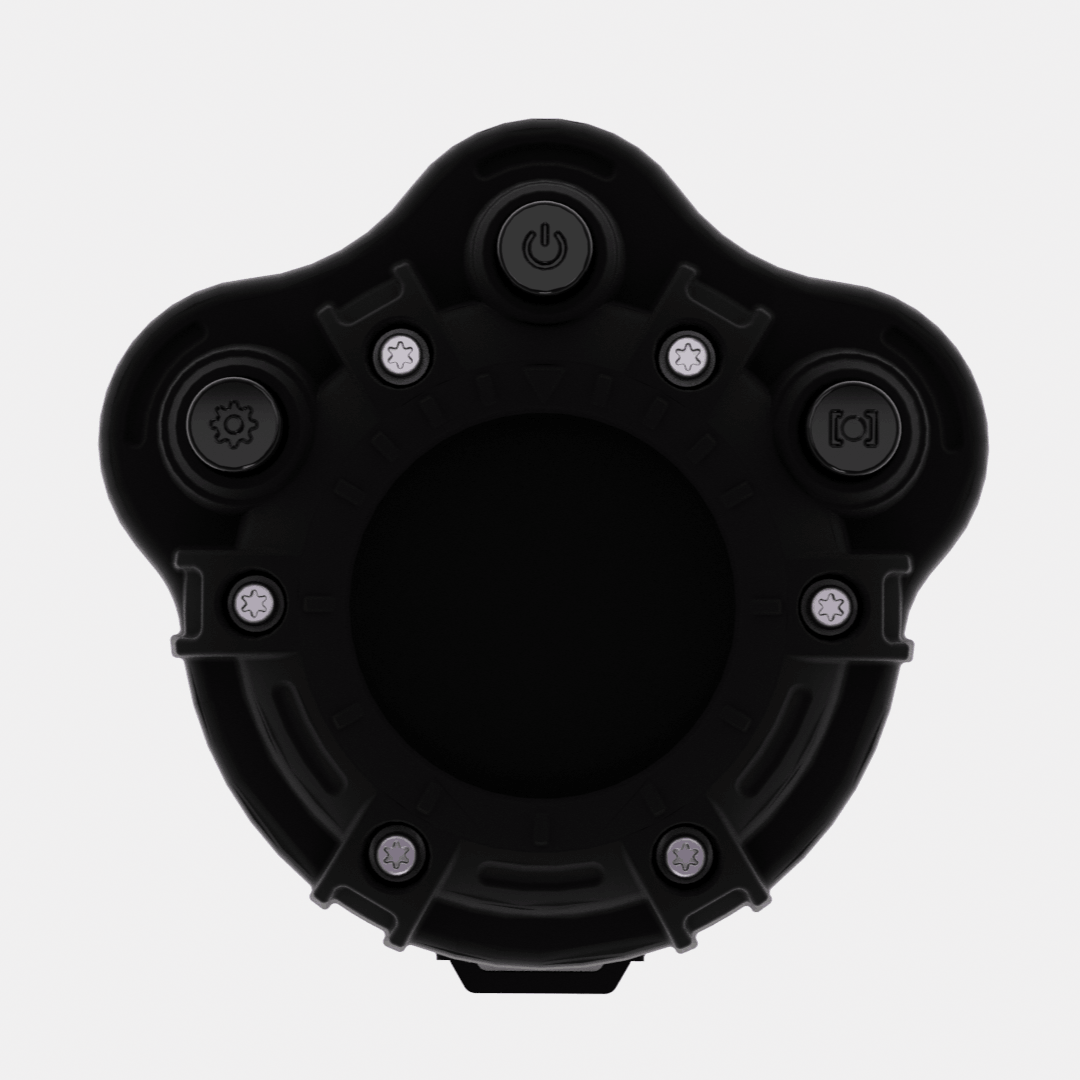
1.69" LCD · 240×280
TTPMS · 18-month battery
IR · 1000Hz thermal
Against the alternatives.
For the engineers.
How does the IR sensor avoid being fooled by sunlight or road heat?
The IR sensor uses dual-wavelength differential pyrometry. It samples two adjacent infrared bands and subtracts the ambient radiation component, isolating the tread's emissive signature regardless of solar load or hot tarmac underneath.
What happens if a sensor fails or runs out of battery mid-ride?
The T-Grip algorithm degrades gracefully. If a single signal drops out, the remaining four are reweighted automatically and a confidence indicator on the display reflects the reduced certainty. You always know when the system is operating at less than full accuracy.
How is the algorithm validated?
Every firmware release is validated against a reference dataset of 12,400 laps collected with the Honda LCR Castrol MotoGP team across 28 track configurations and seasonal conditions. New compound profiles undergo on-track validation before being released to production firmware.
Can I export the raw data?
Yes. The companion app exports session data as CSV (human-readable), GPX (mapping software), or MAT (MATLAB / Octave / Python). All signals are timestamped at native sample rate; no downsampling. Storage is local — your data never leaves your device.
What's the firmware update cadence?
Quarterly major releases. Monthly bugfix patches. New compound profiles roll out as tire manufacturers release new generations. All updates are free for the life of the device — there are no premium tiers behind a paywall.
See the numbers under your tires.
The fastest way to understand the technology is to feel the difference on your next ride.